

The Gulfstream G-IV, with its relatively small interior but high altitude capability, is ideally suited for collecting profile data of temperature, humidity, pressure and winds from GPS dropsondes deployed from the aircraft as it circles the storm as shown in the figure of an earlier posting. The data from these sondes is processed and coded at the "Aspen" station prior to being transmitted back to the computer site on the ground where it is used to improve the storm track forecast. Other stations on the aircraft are the Flight Director position, the Main Aircraft Data Station (MADS) and the dropsonde station called AVAPS (Aircraft Vertical Atmospheric Profiling System).
Often I am asked the cost of one of the dropsondes. Weighing less than a pound but carrying some complex electronics including a full GPS system its current cost is $750. Approximately 25 are launched from the aircraft during each surveillance mission. None of them is recovered.
To save you the trouble of doing the math, that's $18,750 just for the sondes. But the data from each flight can improve the forecast by as much as 30 percent, saving countless dollars of preparation costs and ultimately lives.
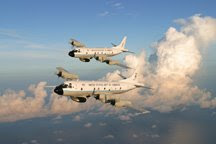
The Lockheed WP-3D Orion, being much larger, can carry considerable more instrumentation as well as the technicians and scientists to operate or monitor them. The schematics to the left
show the NOAA P-3 and many of the instruments and radars that it utilizes for hurricane and other related environmental research activities. There are five major types of data that we collect on the Orions. The first is flight level data such as temperature, pressure, humidity, aircraft attitude(roll, pitch, side slip and the like) and navigation information such as position, heading, track, etc. Wind speed and direction are not measur
ed. They are computed from a number of other measurements and they are very accurate. So, when a NOAA P-3 transmits a wind speed and direction from the hurricane, you can consider that it is on the money.
The second type of information comes from the two research radars on the

aircraft. The lower fuselage radar housed in the big dome underneath the plane gives a map view of the weather surrounding us out to a distance of about 200 miles. The presentation looks very similar to what you see on you home TV, as shown in the image to the right of a well developed Hurricane Georges. The tail radar rotates around the center axis of the aircraft giving us a vertical slice through the storm. A typical image from this radar, taken in Hurricane Georges at the same time as the lower fuselage image, shows the structure of the eyewall and rainbands surrounding the storm. It is also a doppler radar which can be used to derive horizontal wind fields as shown in an earlier blog.

The third type of data collected aboard the WP-3D come from devices that we launch during the mission. Thereare two such types, one being the vertical profile information in the atmosphere that we obtain from GPS dropsondes as described above and the second being vertical profiles of temperature in the ocean acquired from buoys that we also deploy from the plane. Ocean temperature (heat content) is important as this is where the hurricane gets its energy.
The fourth type of data comes from cloud particle probes that we carry in a pylon suspended below the wing of the aircraft. These probes provide scientists with information about the size, shape and type of particles in the clouds surrounding the storm. Knowing this is important because as cloud drops freeze, they release heat which further fuels the hurricane. It helps the scientists better understand the dynamics, or inner workings, of the storm.
The fifth instrument of importance is the Stepped Frequency Microwave Radiometer (SFMR) which provides measurements from which surface wind speeds and rain rate in the air below the aircraft. This device, which is installed on all hurricane reconnaissance aircraft, is useful in providing forecasters at the hurricane center a map of surface wind speeds from which they can use in determine the breadth of hurricane and tropical storm force winds. During periods of hurricane activity you will see in the NHC's discussion on its web page, from time to time, mention of this instrument and its product. The NHC web site is: http://www.nhc.noaa.gov/.
There are a number of other specialized instruments carried on the P-3s, but we'll save the discussion of those for another blog.
Next: Hurricane Structure

No comments:
Post a Comment