Monday, June 16, 2008

Preparing for the Season

(click picture to enlarge, the your back button to return)

Here we are nearing the end of June, and save for the short-lived Tropical Storm Arthur, the Atlantic, Caribbean and Gulf of Mexico have and continue to be quiet.  That's a good thing since we are not quite ready to tackle the heart of the season.

Preparing for our annual hurricane program takes a great deal of work by members of the AOC maintenance and engineering staffs because of a number of reasons.  First, gett
ing the planes physically ready to fly into the harsh environment of a hurricane means that we must perform maintenance to ensure that they are in tip-top condition.  Think of it like getting your car ready for a cross-country trip.  You need to put in a lot of time fixing, changing, tweaking and cleaning to be ready for the season.  


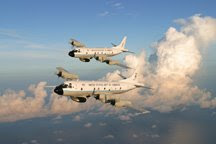
The two NOAA P-3s are over 30 years old, and while they have had the best of care over their lifetimes, they have aged and require more love and tender care than ever.  Comparing the engine of your car with that of the P-3, the latter is comprised of a jet engine connected to a propeller (hence the name turbo-prop) by a very complex gear box.  Lot's of things can go wrong with one of these engines, and each P-3 has four of them.  Above you can see a mechanic working on turbine section of one of these engines while another repairs an electrical de-icing boot on one of the propeller blades.  All of this work is done at the AOC facility located at MacDill AFB in Tampa, FL.  We are located in Hangar #5 on the base - the hangar shown in the movie Strategic Air Command (1955) featuring Jimmy Steward.

The Gulfstream G-IV has all of its maintenance work performed at the Gulfstream plant in Savannah, GA.  This high-performance jet with its sophisticated computers and electronics requires a higher level and extent of technical expertise and equipment than can be provided at
our base in Tampa.  Hence, every Spring, between winter programs and the hurricane season, it undergoes a one-month maintenance cycle in Savannah.  

Another reason for the flurry of activity at this time of year relates to the extensive instrumentation installations, modifications and upgrades that usually precede the hurricane season.  Different projects require different instrumentation, so when we switch from winter operations in places like Alaska or Canada, we have to spend considerable time and effort in accomplishing these changes. 

We are just about finished with all of this activity, and now the waiting begins.  In the meantime, the aircraft will fly some test and calibration flights, and the pilots will accomplish their mandatory annual training requirements.  From here on out, this blog will be all action.

Next:  Tropical Updates and Mission Plans 

Wednesday, June 11, 2008

Hurricane Strructure

The picture above will give you a sense of what a hurricane looks like schematically, from space and from inside the storm itself.  Hurricane Georges is used in this example because the three images shown in the center of the panel, a visible picture from space, a view from the flight deck of a NOAA P-3 in the storm and the LF radar image, were all obtained within minutes of each other.  The two visible satellite images in the lower left, the larger being Hurricane Floyd in 1999 and the smaller Hurricane Andrew in 1992, show how much difference in size hurricanes can be.  Even though Floyd was considerably larger in size, most of the damage sustained in the U.S. was from inland flooding.  Hurricane Andrew, as you are aware, was the last Category 5 storm to strike the U.S., and even though it was small, its high winds and accompanying tornadoes caused a great deal of destruction in southern Miami-Dade Co., FL.
Click on the image for a larger view.

    Next:  Preparing for the season.

Tuesday, June 10, 2008

The Basics - III. Instrumentation


The Gulfstream G-IV, with its relatively small interior but high altitude capability, is ideally suited for collecting profile data of temperature, humidity, pressure and winds from GPS dropsondes deployed from the aircraft as it circles the storm as shown in the figure of an earlier posting.  The data from these sondes is processed and coded at the "Aspen" station prior to being transmitted back to the computer site on the ground where it is used to improve the storm track forecast.  Other stations on the aircraft are the Flight Director position, the Main Aircraft Data Station (MADS) and the dropsonde station called AVAPS (Aircraft Vertical Atmospheric Profiling System).

Often I am asked the cost of one of the dropsondes.  Weighing less than a pound but carrying some complex electronics including a full GPS system its current cost is $750.  Approximately 25 are launched from the aircraft during each surveillance mission.  None of them is recovered. 
 To save you the trouble of doing the math, that's $18,750 just for the sondes.  But the data from each flight can improve the forecast by as much as 30 percent, saving countless dollars of preparation costs and ultimately lives.

The Lockheed WP-3D Orion, being much larger, can carry considerable more instrumentation as well as the technicians and scientists to operate or monitor them.  The schematics to the left 
show the NOAA P-3 and many of the instruments and radars that it utilizes for hurricane and other related environmental research activities.  There are five major types of data that we collect on the Orions.  The first is flight level data such as temperature, pressure, humidity, aircraft attitude(roll, pitch, side slip and the like) and navigation information such as position, heading, track, etc. Wind speed and direction are not measur
ed.  They are computed from a number of other measurements and they are very accurate.  So, when a NOAA P-3 transmits a wind speed and direction from the hurricane, you can consider that it is on the money.

The second type of information comes from the two research radars on the
aircraft.  The lower fuselage radar housed in the big dome underneath the plane gives a map view of the weather surrounding us out to a distance of about 200 miles.  The presentation looks very similar to what you see on you home TV, as shown in the image to the right of a well developed Hurricane Georges.  The tail radar rotates around the center axis of the aircraft giving us a vertical slice through the storm.  A typical image from this radar, taken in Hurricane Georges at the same time as the lower fuselage image, shows the structure of the eyewall and rainbands surrounding the storm.  It is also a doppler radar which can be used to derive horizontal wind fields as shown in an earlier blog.

The third type of data collected aboard the WP-3D come from devices that we launch during the mission.  Thereare two such types, one being the vertical profile information in the atmosphere that we obtain from GPS dropsondes as described above and the second being vertical profiles of temperature in the ocean acquired from buoys that we also deploy from the plane.  Ocean temperature (heat content) is important as this is where the hurricane gets its energy.

The fourth type of data comes from cloud particle probes that we carry in a pylon suspended below the wing of the aircraft.  These probes provide scientists with information about the size, shape and type of particles in the clouds surrounding the storm.  Knowing this is important because as cloud drops freeze, they release heat which further fuels the hurricane.  It helps the scientists better understand the dynamics, or inner workings, of the storm.
The fifth instrument of importance is the Stepped Frequency Microwave Radiometer (SFMR) which provides measurements from which surface wind speeds and rain rate in the air below the aircraft.  This device, which is installed on all hurricane reconnaissance aircraft, is useful in providing forecasters at the hurricane center a map of surface wind speeds from which they can use in determine the breadth of hurricane and tropical storm force winds.  During periods of hurricane activity you will see in the NHC's discussion on its web page, from time to time, mention of this instrument and its product.  The NHC web site is: http://www.nhc.noaa.gov/.  

There are a number of other specialized instruments carried on the P-3s, but we'll save the discussion of those for another blog. 

     Next:  Hurricane Structure

Sunday, June 8, 2008

The Basics - II. Aircraft Crews

In order to obtain the necessary data from these aircraft to support NOAA's hurricane mission we need to crew them with the right kind of talented people to fly the aircraft, operate the scientific equipment aboard and maintain both the plane and instrumentation aboard.  When the aircraft operates at bases away from home, such as the Caribbean Island of Barbados or St. Croix in the U.S. Virgin Islands, it has the right people aboard to make it self-sustaining,  

The crew makeup of the two aircraft is as follow:

           G-IV (max. 11 seats)

2 Pilots
1 Crew Chief
1 Flt. Director/Meteorologist
1 Ass't Met./Dropsonde Data Processor
1 Tech. Crew Chief
1 Dropsonde Operator
1 System Operator

         8 Total

             WP-3D (max 18 seats)

        2 Pilots
         2 Flight Engineers
        1 Crew  Chief
        1 Navigator
        1 Flt. Director/Meteorologist
        1 Tech Crew Chief
        1 Dropsonde Operator
        1 System Operator

       10 Total

The remaining seats on the aircraft are usually occupied by scientists, observers or media.  The G-IV does not have crew positions for flight engineers and navigators.  The crew chief, along with the flight engineers on the more complex WP-3D, perform maintenance on the aircraft when necessary.  The three electronic technicians on each of the aircraft both operate and maintain the scientific systems.  The Flight Dir./Meteologist is responsible for the scientific conduct of the mission.

Next: Basic Instrumentation

Friday, June 6, 2008

The Basics - I. NOAA's Hurricane Aircraft

NOAA utilizes two types of aircraft in its hurricane operations.  The first is the high-altitude Gulfstream G-IVSP (SP stands for special performance), shown at the right, which flies in the 
environment surrounding the storm or in which the storm is forecast to move.  The track shown to the left was flown around Hurricane Dean on 20 August 2007.  Flying between 41,000 and 45,000 ft., the aircraft serves as a platform from which light-weight GPS dropsondes are launched at locations indicated by the numbers in the picture.  These sondes, which descend to the surface with a fall speed of about 3,000 ft/min. while steadied by a small drogue chute, radios temperature, humidity, pressure and sonde position data back to the aircraft twice a second.  Wind speed and direction are computed from the GPS position changes.  These data are processed onboard the aircraft and then transmitted via satellite to NOAA for inclusion in the hurricane forecast model runs.  An improvement in track forecasts of 20 to 30 percent have been realized when GPS dropsonde data from this aircraft has been included in the model forecasts.

The second is the Lockheed WP-3D Orion, a four-engine, turboprop aircraft built expressly for NOAA in the mid-70s by the Lockheed California Co. of Burbank, CA.  These rugged, powerful aircraft are derivatives of the famous Navy P-3s that were used for submarine hunting.  They have served NOAA well for over 30 years in its hurricane activities as well as supporting 
other environmental research programs.

The NOAA P-3s will be supporting several different hurricane projects this season.  Operational support will be given to the National Hurricane Center (NHC) and the National Center for 
Environmental Prediction (NCEP), both part of the NOAA National Weather Service (NWS).  Typical of the types of tracks flown into hurricanes is what we call a Figure 4 pattern as shown here for Hurricane Felix 2007.  
One of the primary efforts this summer will be directed at the collection of Tail Doppler Radar (TDR) data that can be used to derive horizontal wind fields in hurricanes.  Such information as shown to the left for Hurricane Felix (courtesy J. Gamache, NOAA/HRD) can be transmitted via satellite to the NWS where scientists at the NCEP will ingest it into their computer models in an effort to improve intensity forecasts, currently a difficult task.

In addition to the operational missions for the NWS, the P-3s will also support the NOAA satellite service (NESDIS) with flights into regions of high winds and heavy precipitation as found in hurricanes.  This project, called Ocean Winds, is primarily directed at collecting ground truth data for calibrating the QuickScat satellite - a very useful tool for obtaining ocean wind vectors (surface wind speed and direction) from space.  And, these aircraft will also support scientists at NOAA's Hurricane Research Division in their attempts to better understand the life cycle of hurricanes.

Next:  II. Aircraft Crews

Thursday, June 5, 2008

The Season Preview

Now that we are into the hurricane season, it's time to get serious about what may happen this year and what we in the hurricane hunting business are prepared to do to bring better forecasts to anyone threatened by these storms.  

The experts have spoken, and the range of their predictions are:

12 to 15 named storms
6 to 8 hurricanes
0 to 4 major hurricanes (Cat. 3 or greater)

Remember.  These are educated estimates utilizing forecast conditions in the tropics, such as whether an El Nino of La Nina exists in the Tropical Pacific.  Basically they are forecasts based on forecasts.  Only time will tell how well the experts did in 2008.

To date there has been one tropical storm (Arthur) in the Atlantic Basin (Atlantic Ocean, Caribbean Sea and Gulf of Mexico).  Arthur was short-lived, but caused a great deal of flooding in Central America.

In my next blog I'll discuss the NOAA aircraft and crews while giving you an idea of the types of missions we fly, the data we collect and how it is disseminated and used by our clients.

Next:  The Basics - Aircraft, Crew, Instrumentation and Preparation